


Share this
by Jasz Rae Joseph on Wed, Mar 18, 2020 @ 09:00
Digital marketing without data is like a bicycle without wheels; it simply does not work. Digital marketing requires a lot of trial and error. Generally, digital marketers are not their own target audience, so it takes some time to determine which marketing efforts will resonate most with the target audience and, in turn, drive revenue.
Because this article is a deep dive into all things digital marketing analytics, it is a bit lengthy. Use this outline to find exactly what you need:
- What Are Digital Marketing Metrics and Why Are They Important?
- KPIs for Every Digital Marketing Tactic
- Content Marketing
- Email Marketing
- Google Ads
- SEO
- Sponsored Social Media Ads
- Organic Social Media Marketing
- Website Performance
- Common Data Dilemmas
- Presenting Digital Marketing Metrics
- Data Tools

What Are Digital Marketing Metrics and Why Are They Important?
Digital marketing metrics is a broad term used to describe any numerical set of data that is used to define digital marketing campaign performance. It is imperative that every digital marketer sets numeric goals prior to setting up a marketing campaign. Without goals and data, there is no way to attribute sales and revenue growth to digital marketing efforts.
If you are in charge of digital marketing at your company, data can help you determine where to best allocate your marketing budget. Data tells us what is working and what is not working.

KPIs for Every Digital Marketing Tactic
A KPI is a key performance indicator. These metrics tell marketers how their tactics are performing. Because every tactic is different, they each have their own KPIs.
Content Marketing KPIs
- Blog Conversion Rate - the number of leads generated from the blog divided by the number of views a blog received
- If blog conversion rate is low: Ask yourself why people are reading the blog and not converting. Are there prominent conversion points throughout the post? Are you writing about content that resonates with your audience? Does your offer match the content of the post?
- Pageviews - how many views a specific blog post received
- If blog pageviews are low: Promote your blog via social media and email marketing and ensure it is optimized for search engines.
- Bounce Rate - the percentage of people who landed on your blog post from an external website (like Google or social media) and then left your website without visiting any other pages
- If bounce rate is high: Add internal links to other relevant website pages and blogs to give readers opportunities to further engage.
- Blog Subscribers - the number of people who have opted in to receive email notifications when new blog posts are published
- If blog subscribers are low: Ensure every blog post has a visible form for users to subscribe, ensure the content you are creating is speaking to your current subscribers so they do not unsubscribe and promote your blog subscription link via email marketing and social media to reach a broader audience.
- Average Time on Page - the average amount of time users spent viewing a specific blog post
- If average time on page is low: Review the content from your reader’s point of view and determine if it needs to be updated or reformatted to better engage them.
Email Marketing KPIs
- Open Rate - the number of people who opened an email divided by the number of people who received the email
- If open rate is low: Adjust your subject line to entice more readers to open it. Ensure your emails are not going into people’s spam folders by using a tool like isnotspam.com or mail-tester.com.
- Click Rate - the percentage of people who received your email that clicked through, which is calculated by dividing the number of people who clicked by the number of people who received an email
- If the click rate is low: Look at the open rate to determine if people are not opening your email or if they are opening and not clicking. If they are not opening, see the recommendations above for improving open rate. If they are not clicking, see the recommendations below for improving click-through rate.
- Click-Through Rate (CTR) - the percentage of people who opened your email that clicked through, which is calculated by dividing the number of people who clicked by the number of people who opened an email
- If the click-through rate is low: Review the email to ensure it has a strong call-to-action (CTA) that speaks to the recipient’s pain points and needs.
- Deliverability Rate - the percentage of emails that were delivered to their intended recipients, which is calculated by dividing the number of emails delivered by the number that were sent
- If the deliverability rate is low: Review your email list to ensure all email addresses are up to date and came from a reputable source.
Google Ads KPIs
- Cost-Per-Click (CPC) - the price an advertiser pays each time their ad is clicked on
- If your CPC is high: Avoid using competitive keywords and switch your bidding from automatic to manual to help manage CPC.
- Impressions - the number of times your ad is shown either on a search engine results page or via the Google Network depending on the ad type
- If your impressions are low: Look at the quality of your ads to determine if adjustments can be made to improve visibility or revisit the targeting.
- Clicks - the number of times an ad was clicked on
- If your clicks are low: Look at impressions and determine if people are viewing the ad and not clicking or if people are not getting a chance to see the ad. If people are viewing the ad and not clicking, test new ad copy. If people are not viewing the ad, see the recommendations above to improve impressions.
- Click-Through Rate (CTR) - the number of people who clicked on an ad based on the number of people who viewed it, which is calculated by dividing clicks by impressions
- If your CTR is low: Determine if clicks or impressions are bringing it down and follow the recommendations above to improve those metrics.
- Conversions - the total number of people who have taken the desired action (such as requesting a quote) from an ad
- If your conversions are low: Review your landing page messaging, design and functionality to determine why people are viewing it and choosing not to convert.
- Cost-Per-Conversion - the cost of a single conversion given your total ad spend, which is calculated by dividing the number of conversions a campaign generated by the total cost of the campaign
- If your cost-per-conversion is high: Review your keyword list and narrow it to only keywords that generate conversions, not just clicks.
SEO KPIs
- Keyword Rankings - the position your website page is ranking on Google for a specific keyword. Positions 1-10 are on the first page of Google and generally generate the most website traffic.
- If your keyword rankings are low: Optimize your website and blog content for target keywords.
- Organic Sessions - the number of website visits generated via a search engine
- If your organic sessions are low: Check on your on-site, off-site and technical SEO scores to determine what is causing poor performance.
- Domain Authority - This metric may vary depending on the tool or formula you use to determine it. Also known as domain rating, this is a score out of 100 that calculates how many high-authority websites are linking back to your website. Google naturally ranks websites with high domain authorities higher than those with lower domain authorities.
- If your domain authority is low: Acquire backlinks from high authority websites by reaching out to industry publications and asking for links or offering to guest blog.
- Technical Health Score - This metric may vary depending on the tool or formula you use to determine it. At SyncShow, we use the SEMrush site audit tool to determine a site’s technical health. This percentage, out of 100, tells us how many back-end errors a site has, which directly impacts SEO performance.
- If your technical health score is low: Work with your website development team to fix back-end errors.
- Site Speed - This is a score out of 100 that determines how fast or slow your website loads. Site speed is a direct ranking factor and, unlike many SEO metrics that require some speculation and uncertainty, Google provides this KPI to marketers via their PageSpeed Insights tool. Notice that site speed varies based on device.
- If your site speed is low: Work with your website development team to fix the issues causing the site to slow down.
Sponsored Social Media Ad KPIs
- Impressions - the number of times an ad is shown onscreen
- If impressions are low: Review your targeting and get more niche, if applicable.
- Clicks - the number of times an ad was clicked on
- If clicks are low: Test new ad copy or imagery to determine if different messaging or visuals resonate better with your target audience.
- Click-Through Rate (CTR) - the number of people who clicked on an ad based on the number of people who viewed it, which is calculated by dividing clicks by impressions
- If CTR is low: Use the recommendations above to improve impressions and clicks.
- Cost-Per-Impression (CPM) - the price an advertiser pays each time their ad is seen
- If cost-per-impression is high: Review where your ads are running and only run them in the places they are performing best, like the news feed or timeline.
- Cost-Per-Click (CPC) - the price an advertiser pays each time their ad is clicked on
- If your CPC is high: Work to improve your relevance score (if using Facebook ads) and focus on improving qualified clicks.
- Conversions - the total number of people who have taken the desired action (such as requesting a quote) from an ad
- If conversions are low: Review your landing page messaging, design and functionality to determine why people are viewing it and choosing not to convert.
Organic Social Media KPIs
- Engagement - the number of likes, comments and shares a post receives on a social media channel
- If engagement is low: Review top-performing posts on your accounts and competitors’ accounts to determine which content resonates most with the target audience and post more of that type of content.
- Engagement Rate - the percentage of people engaging with your posts, which is calculated by the total number of engagements divided by the total number of followers
- If engagement rate is low: Use the recommendations above to increase the engagement each post receives.
- Followers - the number of people who subscribe to receive your updates on a specific social media channel
- If followers are low: Regularly post and interact with other social media accounts and ensure you are posting content that is relevant and engaging to your target audience.
- Impressions - the total number of times social media users have been shown your content/posts
- If impressions are low: Work to improve engagement rate. Most social media sites will show posts with higher engagement to more users.
- Brand Mentions - when a brand name is mentioned or tagged in a social media post
- If brand mentions are low: Let customers, prospects and partners know that they can ask questions and interact with your brand via social media.
- Sessions from Social Media - the number of website visits that came from a social media channel
- If sessions from social media are low: Ensure every post has a link back to your website and a relevant CTA that entices users to click through.
Website Performance KPIs
- Leads - the number of people who fill out a form on a website, making themselves known contacts
- If leads are low: Ensure your website is properly primed for conversion and has strong CTAs on every page.
- Sessions - the number of visits to a website
- If sessions are low: Implement SEO, social media and/or email marketing campaigns to drive more traffic to your website.
- Conversion Rate - the percentage of visitors who converted into known leads on your website, which is calculated by dividing the number of leads by the number of website sessions
- If conversion rate is low: Ensure every page has a strong CTA with messaging and imagery that speaks to the target audience’s pain points.
- Average Session Duration
- If average session duration is low: Dive into the average time on page for each of your website pages and determine if there are outliers bringing the whole site’s metrics down. If so, target those pages by updating the content to be long-form and speak to the target audience’s pain points.
- Bounce Rate - the percentage of people who landed on a page of the site from an external website (like Google or social media) and then left your website without visiting any other pages
- If bounce rate is high: Dive into the bounce rate for each of your website pages and determine if there are outliers bringing the whole site’s metrics down. Add internal links to other relevant website pages and blogs to give readers opportunities to further engage.
- Sessions by Channel - The breakdown of what channels website visits are coming from. Generally, the channels are organic, direct, referral, social media, email, paid search and other.
- Depending on your key marketing tactics, this metric will change and evolve. For example, if your team is spending significant time and budget on SEO efforts, it makes sense for organic to be the biggest driver of website traffic.

Common Data Dilemmas
Being deep in digital marketing data everyday, we have found some patterns. There are some common dilemmas that our clients often come to us with.
Bounce Rate Is High & Average Time on Page Is Low
Generally, this means that a company is having content or messaging issues. People are finding your website, which is great. However, when they get there, they are not liking what they are seeing. For this, we recommend a content messaging overhaul. Dive deep into your target audience—survey them, spend time with them and put yourself in their shoes. What questions are they asking? How can you be of service to them? Ensure your website copy is not too sales-focused and instead, is extremely customer-centric.
On top of that, ensure the website is primed for conversion. If a company is primarily seeing this issue on their blog, it could mean that people are stopping by to quickly get their answers and then leaving. Use internal linking and strong CTAs to persuade users to stay, learn more and eventually convert into leads.
Pageviews Are High and Blog Subscribers Are Decreasing
People are viewing blog posts and continually unsubscribing. This means that the company is not serving them the content they need. Visitors are enticed by your blog titles and are clicking through to learn more. However, when they get there, they are not finding the content they need. Ask yourself a few questions:
- Are you serving up clickbait? Are your titles too good to be true? Are you giving people false hope regarding what an article will teach them?
- Are your blog articles too company-centric? Are they speaking to the pain points of your target market or are they speaking to the capabilities you have to offer?
- If your business services different markets, are all of these users receiving the same content? Are they regularly receiving content that speaks to a target market different than themselves?
Sessions Are High and Conversion Rate Is Low
This tells us you are driving website traffic, but it is not the right website traffic. Look at Google Analytics to see which channel this traffic is coming from.
- If it is email, scrub your email list and ensure you are marketing to only qualified leads.
- If it is SEO, review the keywords your website is ranking for. Are they relevant to the services you offer?
- If it is referral, dive deeper to see which sites are driving traffic back to your website. Are they the types of websites your target audience hangs out on?
- If it is direct, speak to an analytics professional. Often, high amounts of direct traffic can mean there is a tracking issue.
- If it is social media, review which channels are driving the most traffic. If your company is regularly posting on these channels, review your follower list and determine if they are qualified leads.

Presenting Digital Marketing Metrics
Chances are, if you are reading this article, you not only have to understand and analyze data on your own but you also have to present this data to your higher-ups. There is one important thing to keep in mind when presenting data to your higher-ups: What is their goal? When it comes to marketing, every company is going to have unique goals but they generally narrow down to two key ideas: lead generation and brand awareness.
As marketers, we love data and can quickly get in the weeds on the nitty-gritty of each tactic. Generally, the executive team is looking for a few key metrics from their marketing team:
- Are we generating leads for the sales team?
- Are our leads qualified or are they junk?
- Are we generating buzz and brand awareness?
- What is the ROI on my marketing spend? How much revenue can we attribute to marketing efforts?
Visuals and hard data are key to impressing an executive team. More often that not, the frilly metrics like social media likes are not the metrics that should be shared with the executive team. Often, marketers find success when adding a “Key Highlights” slide to the beginning of a data-filled deck. This slide calls out the main points that an executive team would want to know. Then, the rest of the deck can be filled with the details of each tactic for the members of the team who are interested in a data deep dive.

Data Tools
At SyncShow, we use a number of data tools, but the majority of our data comes from two tools: HubSpot and Google Analytics.
HubSpot offers a full platform of marketing, sales, customer service and CRM software. Because HubSpot is an all-in-one platform, it allows for amazing cross-platform analytics. If your team is looking to align sales and marketing and tie marketing campaigns directly to their ROI, HubSpot is the best tool for the job.
Google Analytics gives you the free tools you need to analyze data for your business in one place. If you are new to the tool, the Google Analytics Academy is a great place to start. At SyncShow, we never make a marketing decision without looking at Google Analytics as it provides the most accurate website metrics you can find.
SEO Tools
Because SEO is such a data-driven tactic and a lot of SEO data, like keyword rankings and backlink information, can’t be found within Google Analytics, marketers can use a variety of SEO tools to make data-driven decisions.
SEMrush offers solutions for SEO, PPC, content, social media and competitive research. With a free and a paid version, there are options for marketing teams of all levels.
Ahrefs allows you to audit your website, explore competitors and research keywords and backlinks—all in one place. At SyncShow, we find it to be the best tool for off-site SEO assessments. If you are not ready for a paid subscription, get started with their free backlink checker.
Google Search Console is a free service offered by Google that helps you monitor, maintain and troubleshoot your site's presence in Google Search results. Because what could be better than getting SEO data straight from Google?
Screaming Frog SEO Spider is a website crawler that allows you to crawl websites’ URLs to analyze and audit technical and on-site SEO. The free version has plenty of features for marketers looking to do a deeper dive into their website’s health.
Data Presentation Tools
When presenting data to your team, appearance is everything. A slide deck will do the trick, but these tools take things up a notch and integrate with your data tools to bring you real-time reports.
Databox pulls all your data into one place, so you can track performance and discover insights in real-time. Databox has over 70 one-click integrations and over 200 pre-built reports. If you are looking for a quick and easy solution for your regular reporting needs, Databox could be the answer.
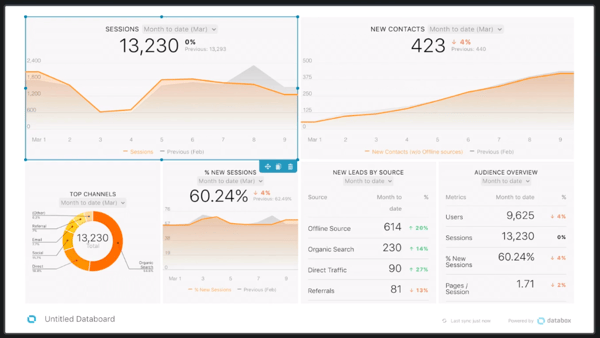
Here is an example marketing website report from Databox.
Google Data Studio is a customizable dashboard and reporting tool that integrates with over 500 data sets from over 200 connectors, including HubSpot and Google Analytics. The best part? Most of the features are free.
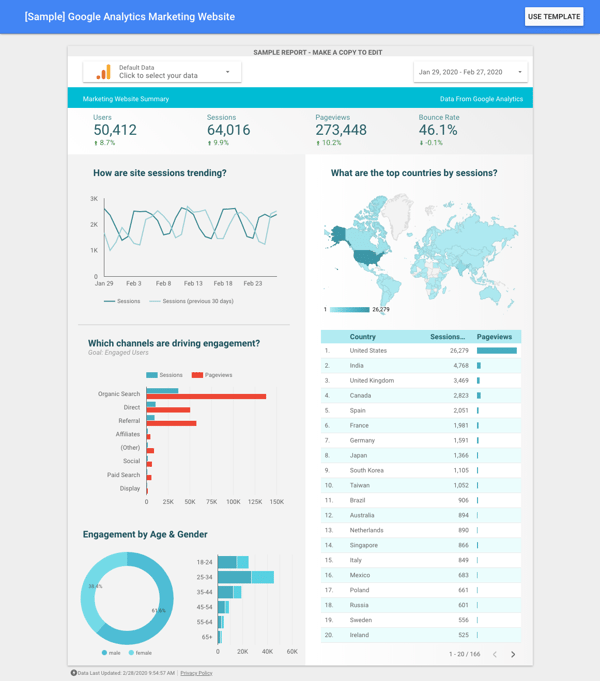
Here is an example marketing website report from Google Data Studio.

Data in Digital Marketing
At the end of the day, data is what makes a digital marketing team successful. Data allows us to make educated decisions, glean insights about our target audience and prove value to the company as a whole.
If you are ready to learn more about data-driven marketing and take your marketing campaigns to the next level, reach out. We would love to learn more about your business.
